Code Tracing - Snort3 main
Tracing Snort3 with GDB
How to read the source code of a large project?
It’s daunting to read exstreamly mass codebase on my own, but I think there might be someone who has been through this before. Therefore I search related keywork to find out what are the most effective way for me to start from a scratch, here are my result:
- Development Documentation
- Start at high level component
- Code tracing
Purpose of the Article:
By using GDB to trace Snort3, I aim to enhance understanding and facilitate the knowledge of development of larger projects.
Introduction - What is Snort? And What’s New about Snort3?
Snort is an open-source network intrusion prevention system (NIPS) and network intrusion detection system (NIDS). Its history began at 1998, a network security expert, Martin Roesch, develope a lightweight network detection system that response to the existing problems of complexity network environment. Since the firewall at that time simply provide policy which determine acceptance bases on packets’ source and destination or protocal, it was so lame in sense of nowaday perspect thus been called static firewall.
At 2001, Martin Roesch found a network security company, Sourcefire Inc, and launch commercial version snort, which can be said to be the predecessor of Firepower, cisco NGFW.
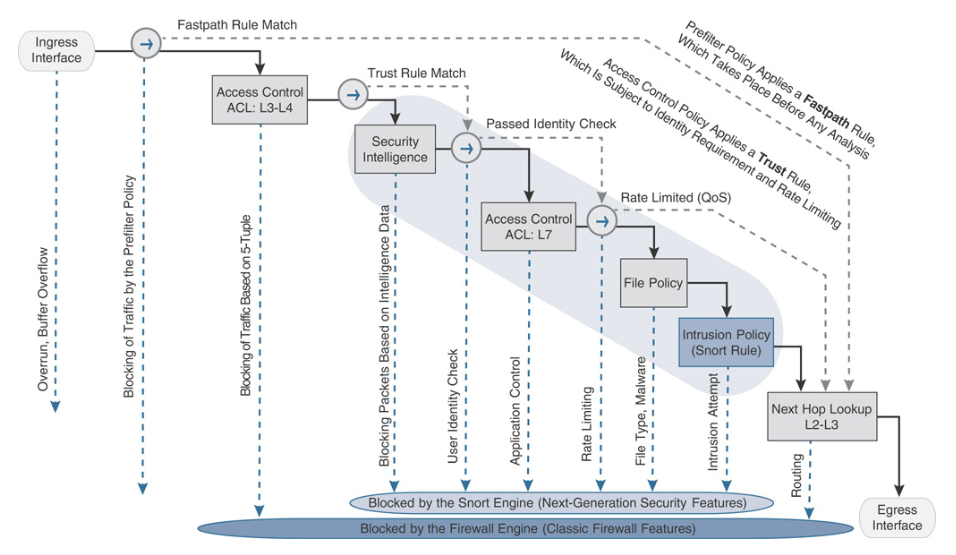
Even though some people may argue about the user-unfriendly functionality and poor performance of the Cisco ASA and Firepower, I believe it is still worth our time to study them, from design methodology to mechanical implementation. Take the graph shown in the book, CCNP and CCIE Security Core SCOR 350-701 Official Cert Guide, for example, we can have a full picture of how IDS collaborate with other component inside firewall.
Futher more, we can also take a step closer to deep inspect how this little piggy function. Again I’d to reference to Cisco’s CCNP and CCIE Security Core SCOR 350-701 Official Cert Guide, it visualize the packet flow throughout the Intrusion Engine. From a scratch, we can realize the mechanism inside the snort, such as Data Acquisition, Preprocessing, Inspection, and Logging. Yes, how amanzing, isn’t it?
According to official Cisco security blog, Snort 3: Rearchitected for Simplicity and Performance, original snort had no longer compatible and capable to cope with network complexity and speed today. Thus Cisco teams refine snort by provide better multi-pattern search engine and use flow-based module instead of packet-based module.
Overview of Develope Document
Here is the official user manual of the snort 2.9.16. Although it mainly focus on how to use it instead of how to develope it, somehow I find it very helpful to obtruse the system operation when first time studying it with no clue at all. Then, there are dozens of dev_notes.txt inside src/* directory. I will pick several for example, depending on our needs, and dive in to see where will it lead us to.
Snort Data Flow – CH5.2 of User Manual
Like wireshark or tcpdump, snort acquire packet from the NIC via libpcap, an open source library used for traffic capture and analysis. Then, packets are passed through a series of decoder to fill out packet structure which determine its Data-Link layer then further decoded for things like Network/Transport layer protocols such as IP, TCP/UDP ports etc.
After decode, packets are sent through the series of preprocessors. Each preprocessor checks specific offset in this packet, which help trigger following procedure: the detection engine checks each packet against the various options listed in the Snort config files, if positve, enter action mode like alarm or block.
dev_notes.txt in Each Source Code Directory
Take src/dev_notes.txt for example, here is the content below. We can obtain the info that there are two components, which under main/* and packet_io/*, corespond to some key feature like services control and packet flow. And most important point, it reveal the clue that the core process, from packet analyzation to threat detection, start after main_loop. It imply that we definitly need to set a break point on main_loop funtion.
This directory contains the program entry point, thread management, and control functions.
- The main / foreground thread services control inputs from signals, the command line shell (if enabled), etc.
- The packet / background threads service one input source apiece.
The main_loop() starts a new Pig when a new source (interface or pcap, etc.) is available if the number of running Pigs is less than configured.
It also does housekeeping functions like servicing signal flags, shell commands, etc.
The shell has to be explicitly enabled at build time to be available and then must be configured at run time to be activated. Multiple simultaneous remote shells are supported.
Unit test and benchmark testbuild options also impact actual execution.
Reload is implemented by swapping a thread local config pointer by each running Pig. The inspector manager is called to empty trash if the main loop is not otherwise busy.
Reload policy is implemented by cloning the thread local config and overwriting the policy map and the inspection policy in the main thread. The inspector list from the old config’s inspection policy is copied into the inspection policy of the new config. After the config pointer is cloned, the new inspection policy elements (reloadable) such as inspectors, binder, wizard etc are read and instantiated. The inspector list of the new config is updated by swapping out the old inspectors, binder etc. with the newly instantiated elements. The reloaded inspectors, binders and other inspection policy elements are marked for deletion. After the new inspection policy is loaded, the thread local config pointer is swapped with the new cloned config by running Pig. This happens in the packet thread. The inspector manager is then called to delete any reloaded policy elements and empty trash.
Besides dev_notes.txt under src directory, there are dozens of dev_notes.txt, over 90+ actually, under others directory such as packet_io/dev_notes.txt or /control/dev_notes.txt .etc. But I am not goint to rush myself buried with these document so quickly.
Overview of Snort3 Source Code Architecture
Instead of exam every peice of develope guide, let’s take an overview of Snort3 source code structure. From previous discussion of data flow, we know the associate module includes preprocessors, detection engine, and output plugins .etc.
Take a glimps of generic module in Snort3 by displaying directory:
1
2
3
4
5
6
7
8
9
10
11
12
13
14
15
16
17
18
19
20
21
22
23
24
25
26
27
28
29
30
31
32
33
34
35
36
37
38
39
40
41
42
43
44
45
46
47
48
49
50
51
52
53
54
55
56
57
58
59
60
61
62
63
64
65
66
67
68
69
70
71
72
73
74
75
76
77
78
79
80
81
82
83
84
85
86
87
88
89
90
91
92
93
94
$ tree -L 1 ./src
./
├── CMakeLists.txt
├── actions
├── catch
├── codecs
├── connectors
├── control
├── decompress
├── detection
├── dev_notes.txt
├── dump_config
├── events
├── file_api
├── filters
├── flow
├── framework
├── hash
├── helpers
├── host_tracker
├── ips_options
├── js_norm
├── latency
├── log
├── loggers
├── lua
├── lua_wrap.sh
├── main
│   ├── CMakeLists.txt
│   ├── ac_shell_cmd.cc
│   ├── ac_shell_cmd.h
│   ├── analyzer.cc
│   ├── analyzer.h
│   ├── analyzer_command.cc
│   ├── analyzer_command.h
│   ├── bootstrap.lua
│   ├── dev_notes.txt
│   ├── finalize.lua
│   ├── help.cc
│   ├── help.h
│   ├── modules.cc
│   ├── modules.h
│   ├── network_module.cc
│   ├── network_module.h
│   ├── numa.h
│   ├── oops_handler.cc
│   ├── oops_handler.h
│   ├── policy.cc
│   ├── policy.h
│   ├── process.cc
│   ├── process.h
│   ├── reload_tracker.cc
│   ├── reload_tracker.h
│   ├── reload_tuner.h
│   ├── shell.cc
│   ├── shell.h
│   ├── snort.cc
│   ├── snort.h
│   ├── snort_config.cc
│   ├── snort_config.h
│   ├── snort_module.cc
│   ├── snort_module.h
│   ├── snort_types.h
│   ├── swapper.cc
│   ├── swapper.h
│   ├── test
│   ├── thread.cc
│   ├── thread.h
│   ├── thread_config.cc
│   └── thread_config.h
├── main.cc
├── main.h
├── managers
├── memory
├── mime
├── network_inspectors
├── packet_io
├── parser
├── payload_injector
├── policy_selectors
├── ports
├── profiler
├── protocols
├── pub_sub
├── search_engines
├── service_inspectors
├── sfip
├── sfrt
├── side_channel
├── stream
├── target_based
├── time
├── trace
└── utils
Whithin such massive code base, where should we dive in? I’ve been thinking about it since begining of this project, and it ended up impossible for me to solve the conundrum by my own. Thanks to powerful tools, like doxygen, I get to know it better because of call-graph, caller-graph and class inheritation drawn in diagram.
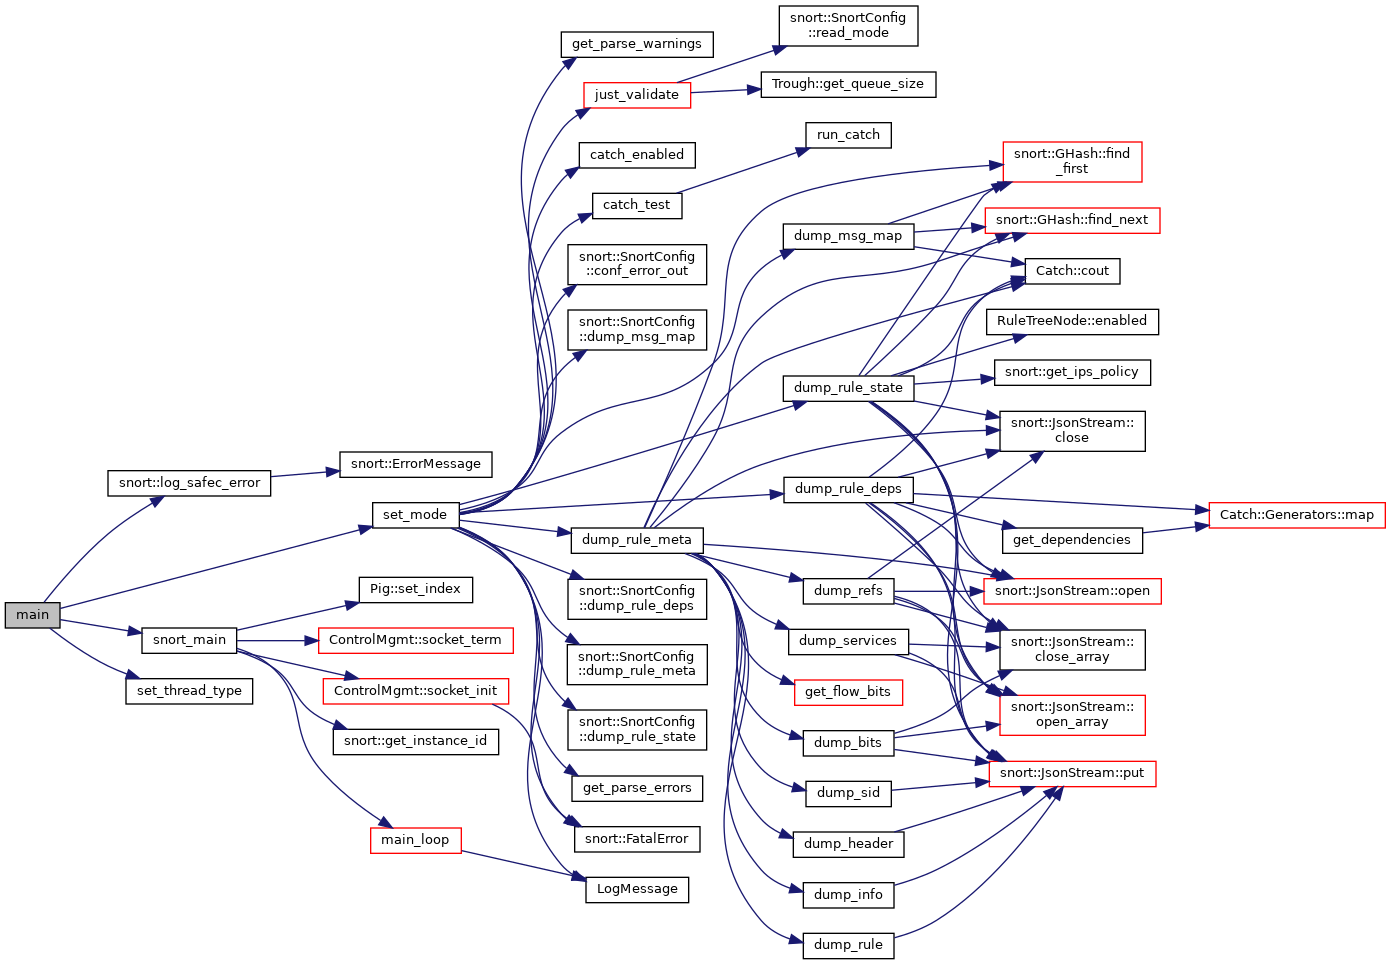
Here is a example of main function and its call diagram. Since main function is the entry function for most programs, it is definitely worthy to take a look.
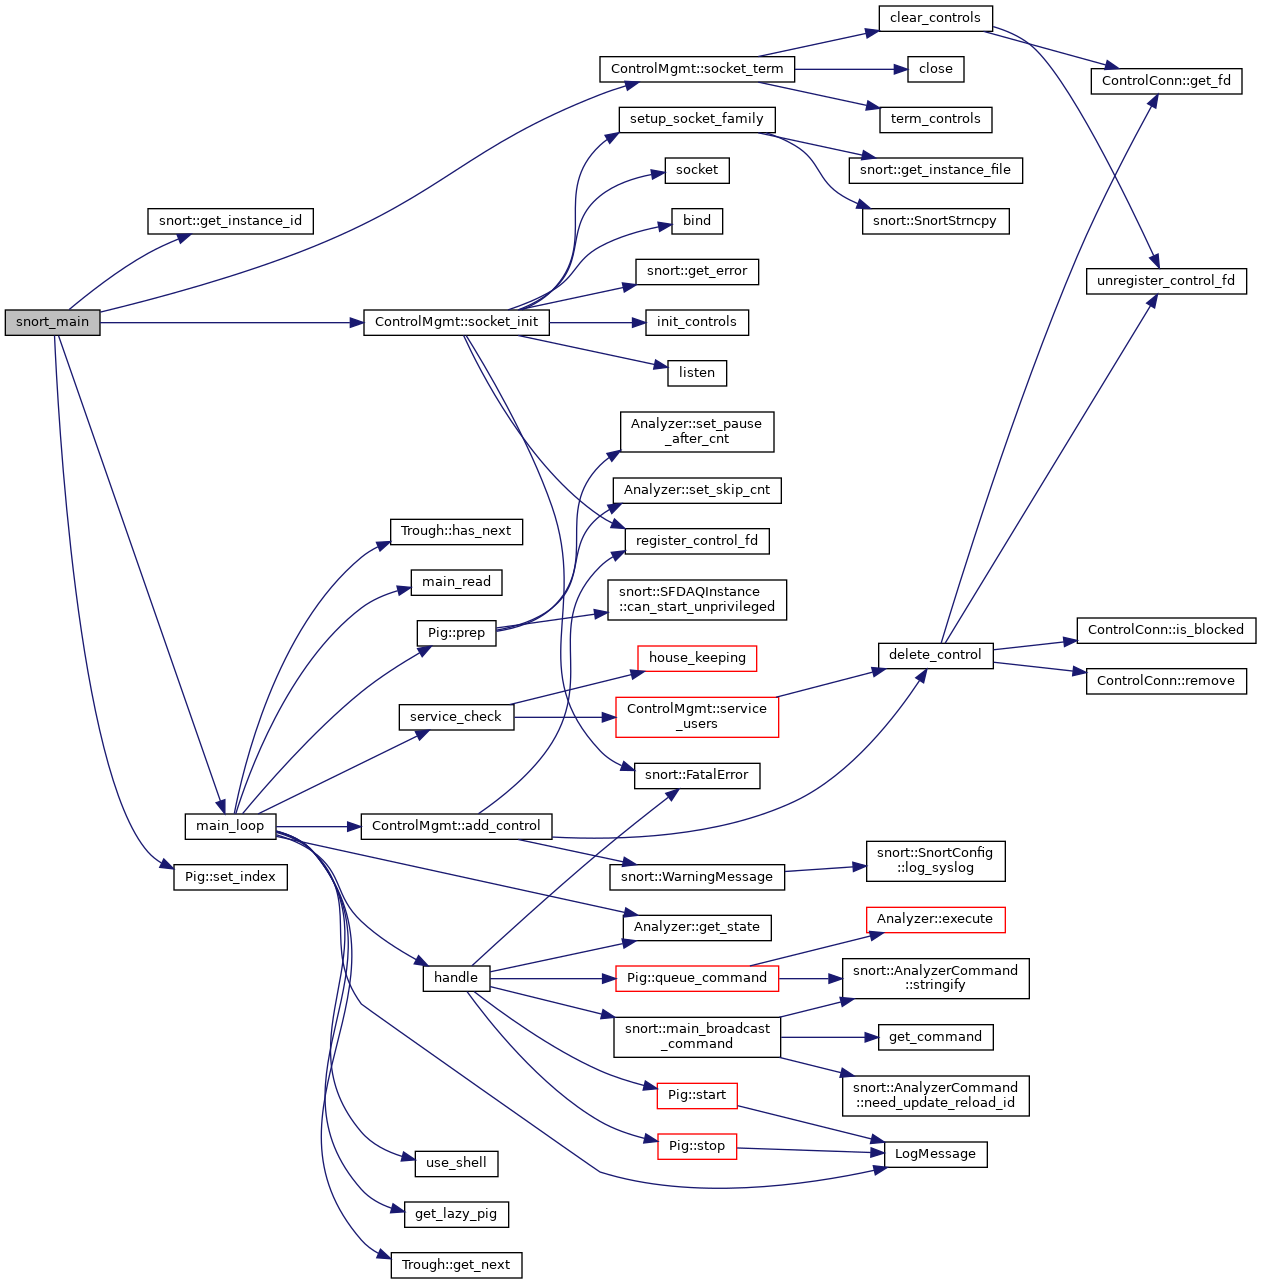
Now, let’s see the diagram below and compare the source code of snort_main, it does two main things. First, initial the socket and the pigs. Second, enter the main_loop.
1
2
3
4
5
6
7
8
9
10
11
12
13
14
15
16
17
18
19
20
21
22
23
24
static void snort_main()
{
#ifdef SHELL
    ControlMgmt::socket_init(SnortConfig::get_conf());
#endif
    // get configuration
    SnortConfig::get_conf()->thread_config->implement_thread_affinity(STHREAD_TYPE_MAIN, get_instance_id());
    <snip>
    pig_poke = new Ring<unsigned>((max_pigs*max_grunts)+1);
    pigs = new Pig[max_pigs];
    pigs_started = new bool[max_pigs];

    for (unsigned idx = 0; idx < max_pigs; idx++) {
        // initialize pig
    }

    main_loop(); // -----> Here is the core function that operate IPS/IDS network detection

    // clean up pig
    <snip>
#ifdef SHELL
    ControlMgmt::socket_term();
#endif
}
Inside main_loop, it repeatly handles and processes the packet from src(interface or pcap), and then do service check. From source code, we can see two classes, class Trough and class Pig, which correspond to packet I/O modules under folder packet_io and snort analyzer modules under main folder.
Interestingly, the developers really do like pigs and absess with such idea, on which we can find the clue on design methology, they illustrate the concept of snort analyzer interact with packet by analogy with how pigs feed on the trough.
1
2
3
4
5
6
7
8
9
10
11
12
13
14
15
16
17
18
19
20
21
22
23
24
static void main_loop() {
    unsigned max_swine = 0, swine = 0, pending_privileges = 0;

    <snip>
    // Preemptively prep all pigs in live traffic mode
    if (!SnortConfig::get_conf()->read_mode())
        <snip>

    while ( swine or paused or (Trough::has_next() and !exit_requested) ) {
        const char* src;
        int idx = main_read();

        if ( idx >= 0 )
            // handle packet

        if (!pthreads_started)
            // make sure threads of pig start to process

        if ( !exit_requested and (swine < max_pigs) and (src = Trough::get_next()) )
            // packet processing

        service_check();
    }
}
From now on, we are going to enter something serious, finally. It’d better for us to scrutinize these two class, Trough and Pig.
Trough obviously deal with packets from source interface or pcap. For further information, we will have another article to trace data flow from physical interface to trough via DAQ.
1
2
3
4
5
6
7
8
9
10
11
12
13
14
15
16
17
18
19
20
21
22
23
24
25
26
27
28
29
30
31
32
class Trough
{
public:
    enum SourceType { SOURCE_FILE_LIST, SOURCE_LIST, SOURCE_DIR };

    static void set_loop_count(unsigned c)
    static void set_filter(const char *f);
    static void add_source(SourceType type, const char *list);
    static void setup();
    static bool has_next();
    static const char *get_next();
    static unsigned get_file_count()
    static void clear_file_count()
    static unsigned get_queue_size()
    static unsigned get_loop_count()
    static void cleanup();
private:
    struct PcapReadObject { SourceType type; std::string arg;std::string filter; };

    static bool add_pcaps_dir(const std::string& dirname, const std::string& filter);
    static bool add_pcaps_list_file(const std::string& list_filename, const std::string& filter);
    static bool add_pcaps_list(const std::string& list);
    static bool get_pcaps(const std::vector<struct PcapReadObject> &pol);

    static std::vector<struct PcapReadObject> pcap_object_list;
    static std::vector<std::string> pcap_queue;
    static std::vector<std::string>::const_iterator pcap_queue_iter;
    static std::string pcap_filter;

    static unsigned pcap_loop_count;
    static std::atomic<unsigned> file_count;
};
Pig, on the other hand, deal with service control and analyzer. Different from the class Trough, Pig collaborate with other classes, like class Analyzer and class Swapper.
1
2
3
4
5
6
7
8
9
10
11
12
13
14
15
16
17
18
19
20
21
22
23
24
25
26
class Pig
{
public:
    Pig() = default;
    ~Pig();

    void set_index(unsigned index) { idx = index; }

    bool prep(const char* source);
    void start();
    void stop();

    bool queue_command(AnalyzerCommand*, bool orphan = false);
    void reap_commands();

    Analyzer* analyzer = nullptr;
    bool awaiting_privilege_change = false;
    bool requires_privileged_start = true;

private:
    void reap_command(AnalyzerCommand* ac);
    Swapper* swapper = nullptr;

    std::thread* athread = nullptr;
    unsigned idx = (unsigned)-1;
};


